Deployment Guide

Full platform running
in under an hour.

XDRagon Monitor installs with a single command on standard hardware. Ubuntu and Debian servers are supported out of the box, macOS on Apple Silicon runs via Docker Desktop, and NVIDIA GPU acceleration is optional. No proprietary appliances. No cloud sign-up.

<1
Hour to Deploy
1
Command to Install
3
Deployment Modes
0
Cloud Dependencies
Step-by-step deployment.

Choose your install track

The one-command installer is the recommended path — a guided wizard that checks prerequisites, configures the environment, and verifies every service. Prefer full control? The manual Docker Compose track produces the same fully featured XDRagon Monitor installation.

1
Check prerequisites
You need an Ubuntu or Debian server (macOS on Apple Silicon works via Docker Desktop). The installer verifies everything else before it touches your system — Docker, available RAM, and free disk space.
checked by the installer
# Docker + Docker Compose (installed if missing)
# 2 GB RAM minimum — core platform
# 10 GB free disk minimum
2
Run the installer
One command downloads the installer and starts a guided setup wizard: prerequisite checks, interactive environment configuration, auto-generated secrets, and a health-check loop that confirms every service came up.
bash
curl -fsSL https://xdragonxdr.com/install.sh | bash
3
Log in
When the health checks pass, open the dashboard and sign in with the admin credentials from the setup wizard. You are required to set a new password on first login.
The platform is available at http://localhost:3000 once all containers reach healthy status. All containers use the xdragon-monitor-* name prefix.
4
Manage the installation
The same script handles the full lifecycle — updates, reconfiguration, and clean removal.
bash
./install.sh --update       # upgrade to the latest release
./install.sh --reconfigure  # re-run the setup wizard
./install.sh --uninstall    # remove the installation
System Requirements
RAM2 GB minimum for the core platform (verified by the installer) — 16 GB recommended for the full local-AI stack
Storage10 GB free disk minimum (verified by the installer) — more for longer event retention
OSUbuntu or Debian server (AMD64) — macOS on Apple Silicon (M-series) via Docker Desktop
SoftwareDocker + Docker Compose — the only hard requirement
GPU (optional)NVIDIA GPU or Apple Silicon Metal — recommended for the full local-AI stack. See the GPU Acceleration tab
1
Install Docker Engine
Install Docker Engine and Docker Compose on your Ubuntu or Debian server. On macOS (Apple Silicon), install Docker Desktop instead.
bash
# Install Docker Engine
curl -fsSL https://get.docker.com | sudo sh
sudo usermod -aG docker $USER

# Verify
docker --version && docker compose version
2
Clone the repository
Clone XDRagon Monitor from GitHub and navigate to the project directory.
bash
git clone https://github.com/XDRagonXDR/xdragon-monitor
cd xdragon-monitor
3
Configure environment
Copy the example configuration and set your admin credentials and optional threat feed API keys.
bash
cp infra/.env.example infra/.env
# Edit infra/.env — set admin credentials and
# threat feed API keys (optional but recommended)
nano infra/.env
4
Start the platform
Docker Compose builds and starts all services and loads the Ollama AI models. The initial model download takes a while depending on connection speed — the full deployment completes in under an hour.
bash
docker compose -f infra/docker-compose.yml \
  --profile linux up -d --build

# Watch startup progress
docker compose -f infra/docker-compose.yml logs -f --tail=50
The platform is available at http://localhost:3000 once all containers reach healthy status. All containers use the xdragon-monitor-* name prefix.
5
Verify & connect sensors
Open the dashboard and check the System Health page — every service is monitored with traffic-light status. Then point your firewall's syslog / Suricata EVE output at the ingest ports and confirm events start arriving.
System Requirements
RAM2 GB minimum for the core platform — 16 GB recommended for the full local-AI stack
Storage10 GB free disk minimum — more for longer event retention
OSUbuntu or Debian server (AMD64) — macOS on Apple Silicon (M-series) via Docker Desktop
SoftwareDocker + Docker Compose — the only hard requirement
NetworkReachable from your firewall's syslog / EVE JSON output for sensor ingest
1
Install NVIDIA drivers and CUDA toolkit
Install the NVIDIA Container Toolkit to expose the GPU to Docker containers.
bash
# Install NVIDIA Container Toolkit
curl -fsSL https://nvidia.github.io/libnvidia-container/gpgkey | sudo gpg --dearmor -o /usr/share/keyrings/nvidia-container-toolkit-keyring.gpg

# Configure and install
sudo apt-get install -y nvidia-container-toolkit
sudo nvidia-ctk runtime configure --runtime=docker
sudo systemctl restart docker

# Verify GPU access in Docker
docker run --rm --gpus all nvidia/cuda:12.3.0-base-ubuntu22.04 nvidia-smi
2
Deploy with the GPU override
Add the GPU override file to the standard compose command. It mounts the NVIDIA runtime and enables CUDA acceleration for Ollama, significantly reducing AI response latency.
bash
docker compose -f infra/docker-compose.yml \
  -f infra/docker-compose.gpu.override.yml \
  --profile linux up -d --build

# Verify GPU usage
watch -n2 nvidia-smi
3
Apple Silicon — no override needed
On Apple Silicon (M-series), Ollama runs natively on macOS and uses Metal GPU acceleration automatically. No override file or extra configuration is required.
With GPU acceleration, the autonomous background jobs and interactive AI features can run simultaneously without impacting response latency.
Recommended for the Full Local-AI Stack
GPUNVIDIA GPU with 6 GB+ VRAM, or Apple Silicon (Metal)
CUDACUDA 12.1+ (driver 525.60.13+) for NVIDIA deployments
RAM16 GB+ system RAM recommended for the full local-AI stack (core platform runs on 2 GB)
VRAM12 GB+ recommended for concurrent model serving
OSUbuntu or Debian with nvidia-container-toolkit (NVIDIA), or macOS on Apple Silicon
DEPLOYMENT OPTIONS

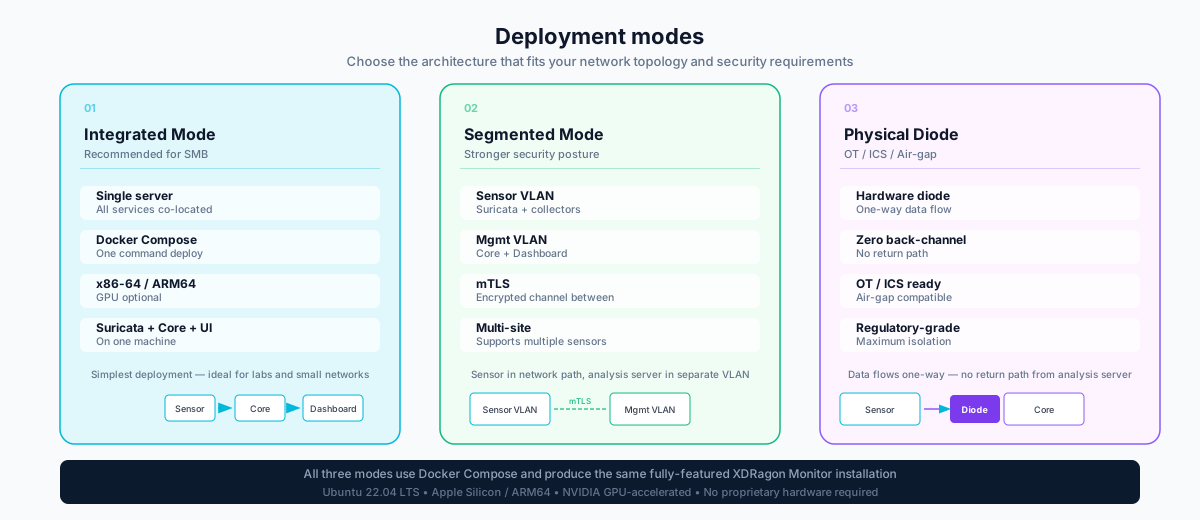
Three deployment modes — choose the setup that fits your SMB growth stage

XDRagon Monitor runs in three modes: Integrated (fully connected), Segmented (external enrichment routed through a relay — the backend never touches the internet directly), and Physical Diode (fully air-gapped). You can switch between them later, guided from the UI.

XDRagon Monitor deployment modes for SMB
Day-2 Operations.

Built for running, not just installing

XDRagon Monitor ships with the operational plumbing most self-hosted platforms leave as an exercise: automatic backups with guided restore, continuous self-monitoring, and deployment-mode changes handled by a wizard.

Automatic Backup & Restore Wizard
Scheduled daily · guided restore
Daily database backups run automatically with seven-day retention, optional S3 upload, and on-demand manual backups with download. Restoring is a guided wizard that takes an automatic safety backup before touching anything — and backup status is visible on the health dashboard.
System Health Dashboard
Self-monitoring · 24 h history
The platform watches itself. Database, IDS engine, AI runtime, scheduler, disk, and memory are checked continuously with traffic-light status, a sidebar widget, a dedicated health page, and 24-hour history — you know immediately if a component is struggling.
Deployment Wizard & Mode Switching
Integrated · Segmented · Physical Diode
Start in one mode and change your mind later. Switching between Integrated, Segmented, and Physical Diode is a guided wizard in the UI: preview the change, see the impact on features, then commit — no compose-file surgery required.
Open Source. Battle-tested.

Built on proven open components

XDRagon Monitor is assembled from battle-tested technologies. Every component can be inspected, extended, and integrated with your existing toolchain.

Frontend
React 19 + TypeScript + Vite
Single-page application with live streaming AI responses (SSE). Custom design system with CSS variables. Dark/light mode.
Backend API
FastAPI (Python)
Async REST API with server-sent event streaming. mTLS authentication for sensors. OpenAPI documentation auto-generated.
IDS/IPS Engine
Suricata
Industry-standard IDS with EVE JSON log output for structured parsing — via the bundled network sensor, the pfSense Suricata package, or UniFi Threat Management. Firewall logs arrive over syslog from pfSense, OPNsense, FortiGate, Sophos, and UniFi.
Primary Database
PostgreSQL 16 + pgvector
Relational storage for all alerts, events, and compliance data. pgvector extension powers semantic search with embeddings.
Time-Series DB
TimescaleDB
Hypertable extension for efficient storage and querying of high-volume time-series network event data.
AI Runtime
Ollama + qwen2.5:7b
Local LLM serving. Supports CUDA, Metal (MPS), and CPU fallback. Six custom Modelfiles with security-focused system prompts.
ML & Statistical Detectors
scikit-learn + XGBoost
Isolation Forest (behavioral anomaly detection), XGBoost (alert triage), HDBSCAN (alert clustering), n-gram/entropy models (DGA/tunneling), and statistical interval-regularity analysis (C2 beaconing).
Cache / Rate Limiting
Redis 7
AI response caching, per-user rate limiting, and session protection such as login brute-force lockout.
Task Scheduler
APScheduler
Manages all autonomous background jobs — classification, correlation, briefings, hunts, backups, and certificate rotation — with job execution audit logging.
Quick Command Reference.

Quick command reference

Common operations for managing your XDRagon Monitor deployment.

Installer Lifecycle
# Install (guided wizard)
curl -fsSL https://xdragonxdr.com/install.sh | bash

# Upgrade to the latest release
./install.sh --update

# Re-run the setup wizard
./install.sh --reconfigure

# Remove the installation
./install.sh --uninstall
Service Management
# Start all services
docker compose -f infra/docker-compose.yml --profile linux up -d --build

# Stop all services
docker compose -f infra/docker-compose.yml --profile linux down

# View all container status
docker compose -f infra/docker-compose.yml ps

# Follow logs (all services)
docker compose -f infra/docker-compose.yml logs -f

# Or use the bundled control script
./xdragon-control.sh
Backup & Restore
# Automatic daily backups run out of the box —
# manage schedule, S3 upload, and guided restore in the UI.

# Manual database backup
docker exec xdragon-monitor-postgres pg_dump -U appuser -d securitydb > backup.sql

# Manual restore
docker exec -i xdragon-monitor-postgres psql -U appuser -d securitydb < backup.sql
Health & AI Models
# Platform health
curl http://localhost:8080/api/health

# Feature health (no auth required)
curl http://localhost:8080/api/health/features

# AI runtime status
curl http://localhost:8080/api/ai/status

# List loaded AI models
docker exec xdragon-monitor-ollama ollama list

Questions about deployment?

The architecture docs cover all three deployment modes in depth. XDRagon Monitor is developed upstream-only by a single maintainer — feature requests are free and evaluated against the roadmap, and sponsored priority slots can fund expedited development of a specific feature. See wi24rd.com for how that works.